GPU Cost Efficiency: A >20× Span on One NVIDIA L4
Your GPU dashboard says "100% utilized" — but that tells you nothing about efficiency. We measured a single NVIDIA L4 running an AI model and found a >20× gap in cost per useful token depending on batching. Same GPU, same price, same utilization — 20× difference in real cost. The data is open source so you can verify it yourself.

The problem: price per token hides real costs
When you pay for AI inference — whether through an API or your own GPUs — you typically see a price per token. But this number hides a crucial reality: the actual cost of producing those tokens can vary more than 20× depending on how the work is organized.
Think of it like a restaurant kitchen: two kitchens with identical equipment and staff can have wildly different costs per meal, depending on whether they cook one dish at a time or batch similar orders together. The "utilization" (how busy the kitchen looks) tells you almost nothing about efficiency.
What we actually measured
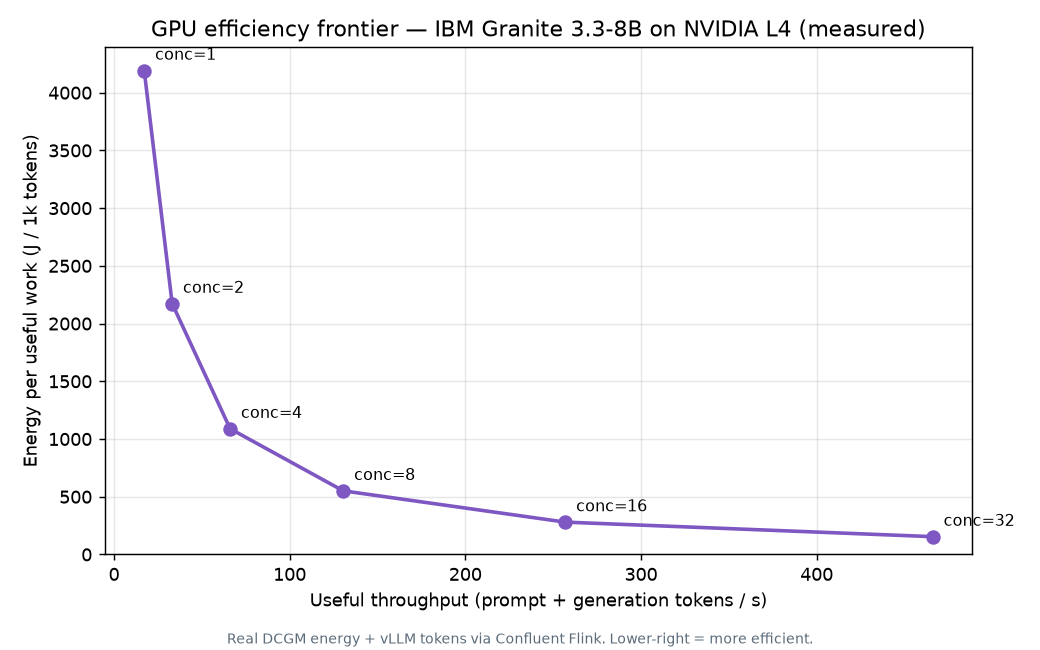
We ran a real AI model (IBM Granite 3.3-8B) on a single NVIDIA L4 GPU that costs $0.85/hour. We tested different "batching" scenarios — processing 1 request at a time vs. 32 at a time — while measuring:
- Energy consumption (joules per 1,000 useful tokens)
- Cost (dollars per 1 million useful tokens)
- GPU utilization (how "busy" it looked)
The result: 20× efficiency gap at "100% utilization"
| Concurrency | GPU util | J / 1k useful | $ / 1M useful |
|---|---|---|---|
| 1 | ~100% | 3,359 | $11.13 |
| 2 | ~100% | 2,185 | $7.18 |
| 4 | ~100% | 1,084 | $3.56 |
| 8 | ~100% | 548 | $1.80 |
| 16 | ~100% | 278 | $0.91 |
| 32 | ~100% | 154 | $0.51 |
Why "100% utilization" is misleading
Here's the catch: GPU utilization looked the same (~100%) at every level. A standard monitoring dashboard would tell you the GPU is "fully utilized" whether you're processing 1 request or 32. Only by measuring cost per useful token can you see the real efficiency gap.
This is what we call the "utilization lie" — the metric everyone watches tells you nothing about actual efficiency.
Cross-check: comparing two models
To make sure this wasn't a fluke, we ran the exact same test with a different model (Mistral 7B). The results:
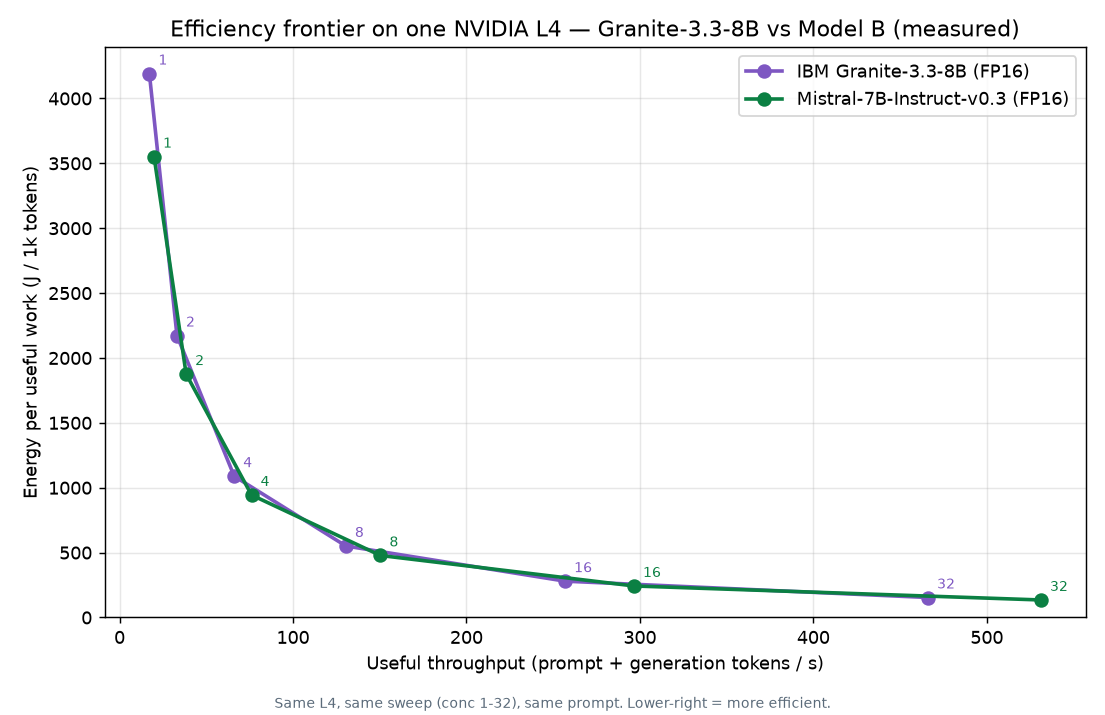
Mistral 7B came out 12-15% more efficient at every batching level. Both GPUs drew the same power — the difference is that the smaller model processes more tokens per second. This metric can help platform teams choose the right model for their cost targets.
Live pipeline: how it works in practice
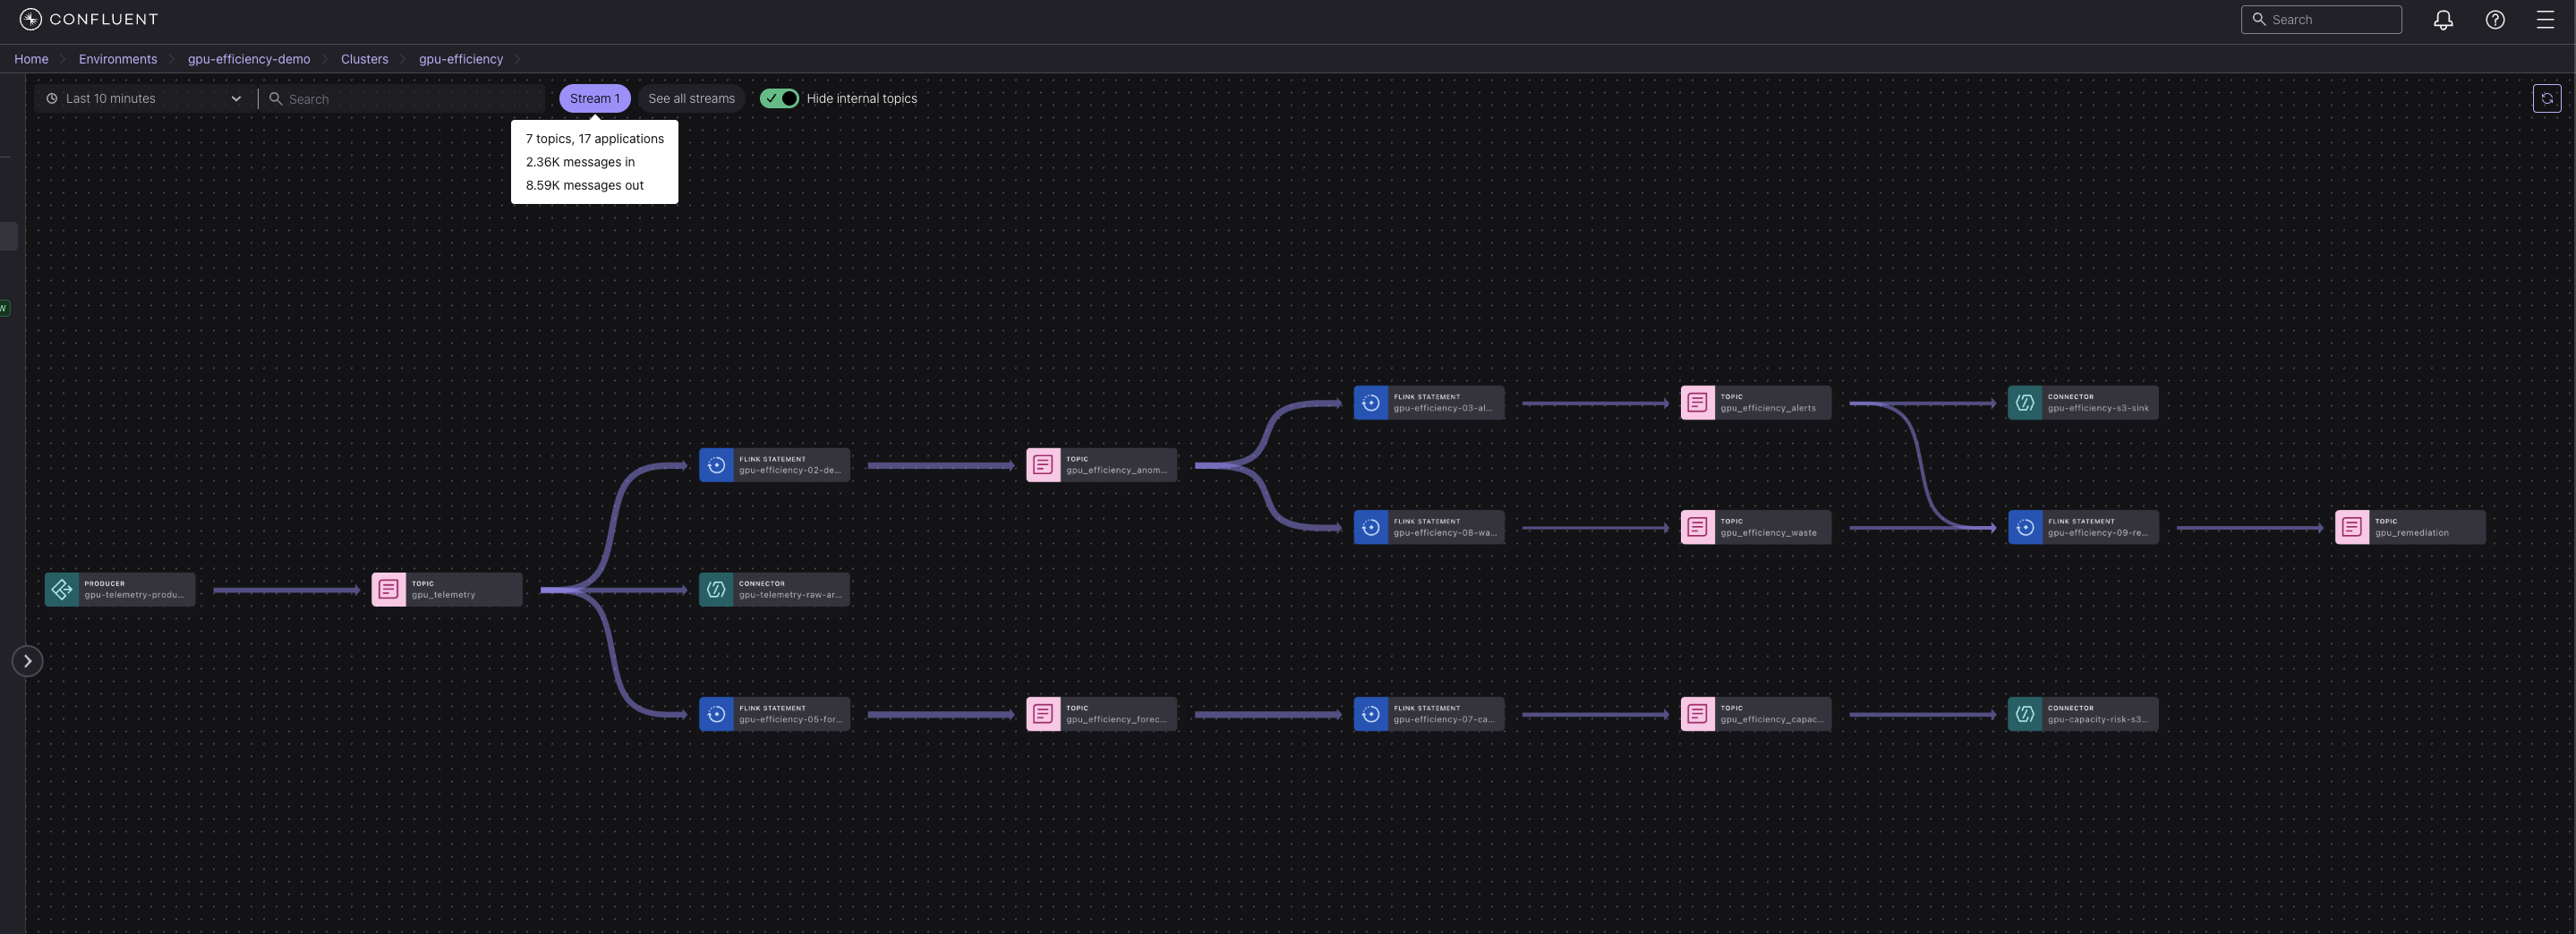
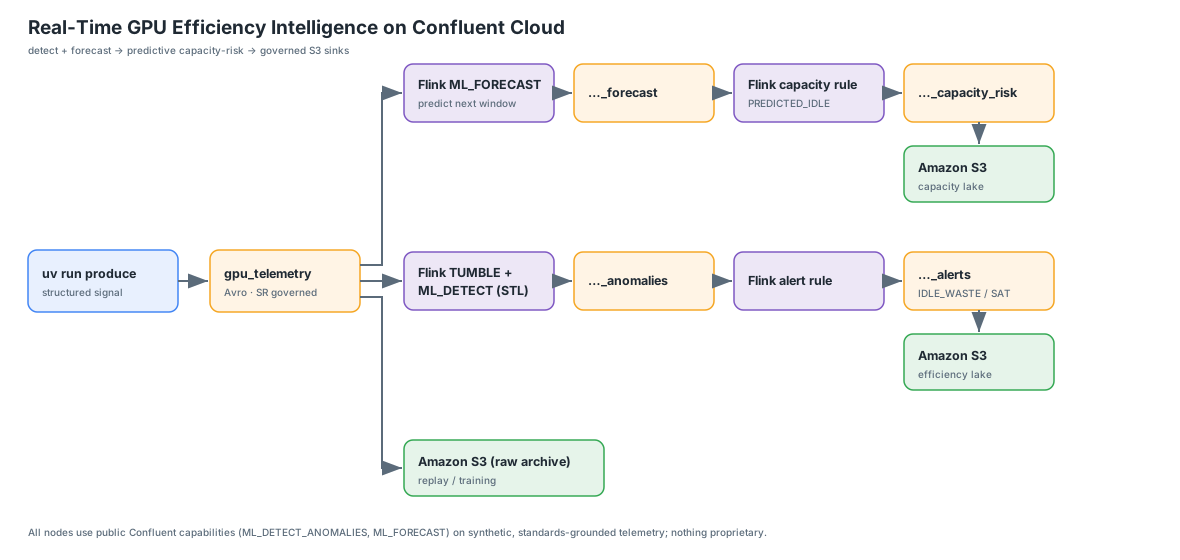
This isn't just a one-time measurement. The pipeline runs continuously, detecting inefficiency in real-time and flagging when your GPUs are "busy but wasteful" — high utilization but low useful output.
What does this mean for your AI costs?
If you're running AI workloads, your actual costs might be anywhere on this 20× spectrum — and you probably don't know where. The standard metrics (utilization, token count) won't tell you.
The good news: this is measurable and fixable. By tracking cost per useful token instead of just utilization, you can identify inefficient workloads and optimize them.
Reproduce it yourself
Everything here is open and reproducible. The full dataset (5,356 raw telemetry records), the analysis notebooks, and every chart you see above are available under Apache-2.0 license.
- Raw data: Complete GPU telemetry from the test runs
- Notebooks: Jupyter notebooks that regenerate all charts
- Methodology: Full documentation of how measurements were taken
View the observation on GitHub →
Don't take our word for it — run the numbers yourself. The token price told you one story. The efficiency frontier tells you the real one.
Frequently Asked Questions
Can I save 20× on my GPU costs?+
Not directly — the 20× is the gap between worst-case and best-case batching on the same GPU. Your actual savings depend on where you currently sit on this efficiency curve. The point is: you need to measure cost-per-useful-token, not just utilization, to know where you stand.
Why does my GPU show 100% utilization but still waste energy?+
GPU utilization measures how busy the hardware looks, not how efficiently it's producing useful output. Processing 1 request at a time keeps the GPU "busy" but wastes most of its potential. It's like a restaurant with one chef cooking one meal at a time — always busy, but inefficient.
How can I check my own efficiency?+
You need to track tokens produced per unit of energy or cost, not just GPU utilization. Our open-source repo includes the methodology and tools. For production systems, Lutflow's Sentinel can measure this continuously from your own telemetry.
Can I reproduce these results?+
Yes! The full dataset (5,356 telemetry records) and analysis notebooks are Apache-2.0 licensed on GitHub. You can regenerate every chart and number without needing a GPU — just run the notebooks on the published data.